


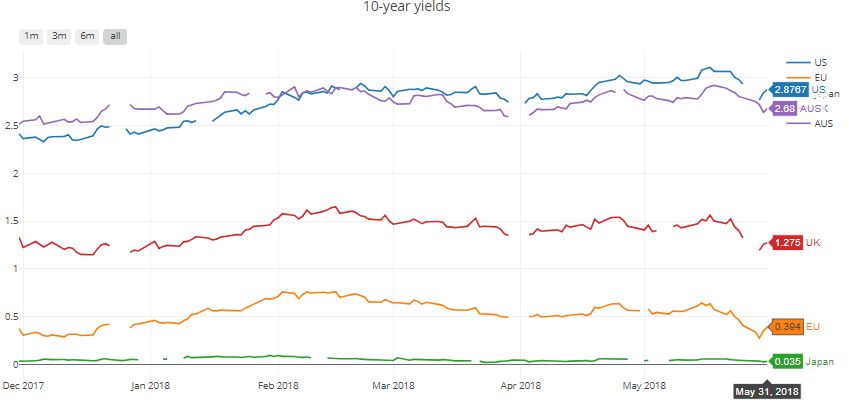
SEK and EUR are the top G10 gainers, up +0.57% and +0.44% (vs USD) while JPY is the top losers, down -0.06% (vs USD). The Euro-area inflation rate (flash) reported an unexpected jump in headline numbers (1.9% actual vs 1.6% expected); though this may not provide a change in ECB outlook it does provide some respite for the EUR. The EUR has not risen much, post the release because the country wise release suggested that CPI will beat consensus. Overnight, the Chinese manufacturing PMI also reported strong numbers (51.9 actual vs 51.4 consensus) helping improve risk sentiments. In the equities space, the Nikkei 225 has closed higher by +0.83% at 22,201 and the other Asian equities have also risen with Hang Seng up +1.37% at 30,468. The European equity indices, however, are trading mixed with FTSE down -0.12%, DAX down -0.27%, and CAC up 0.34%. In the rates market, the global yields continue to improve with US 10-year yield trading at 2.88% (up 3bp today) and the Bund 10-year yield trading at 0.40%(up 4bp today). In the energy space, the Brent front month is trading flat for the day at $77.30 after a sharp bonce yesterday from near the support area at $74.50. The next resistance for Brent now comes in at $78.20. In terms of data today, the Canadian Q1 GDP and the US PCE prices at 1230 GMT are the key releases for Thursday.
10-year Yields Daily chart (6-month)
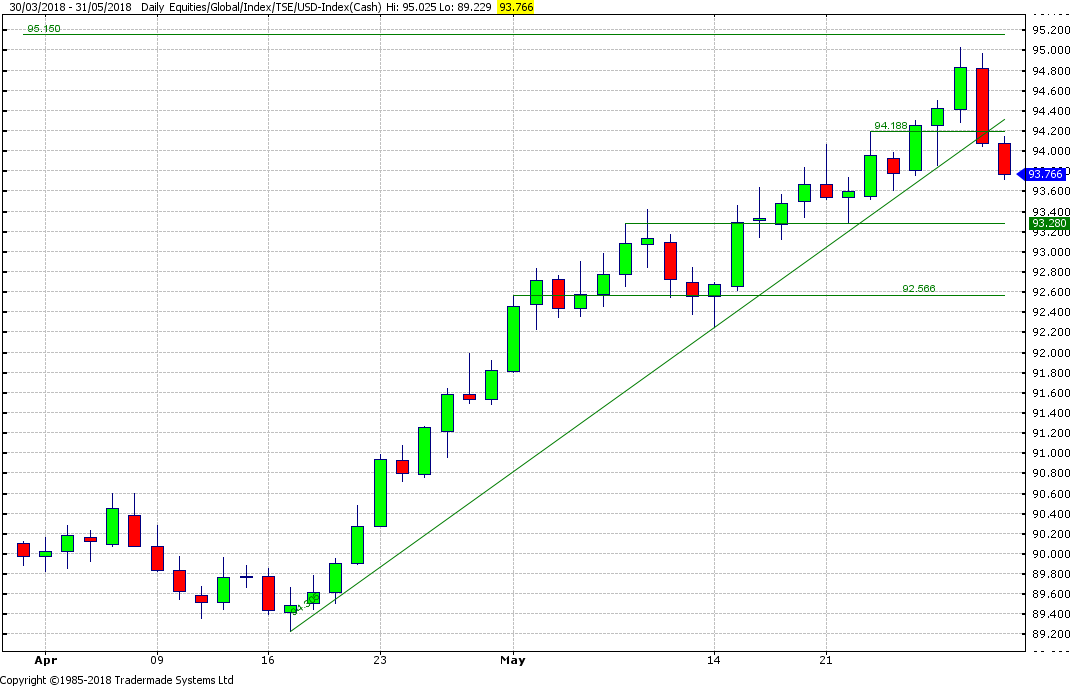
USD-Index Daily chart (2-month)
Brent Front month Daily chart (2-month)

Trade weighted basket Hourly (one-week)

Major Currency Pairs
EURUSD Chart (Two-week)
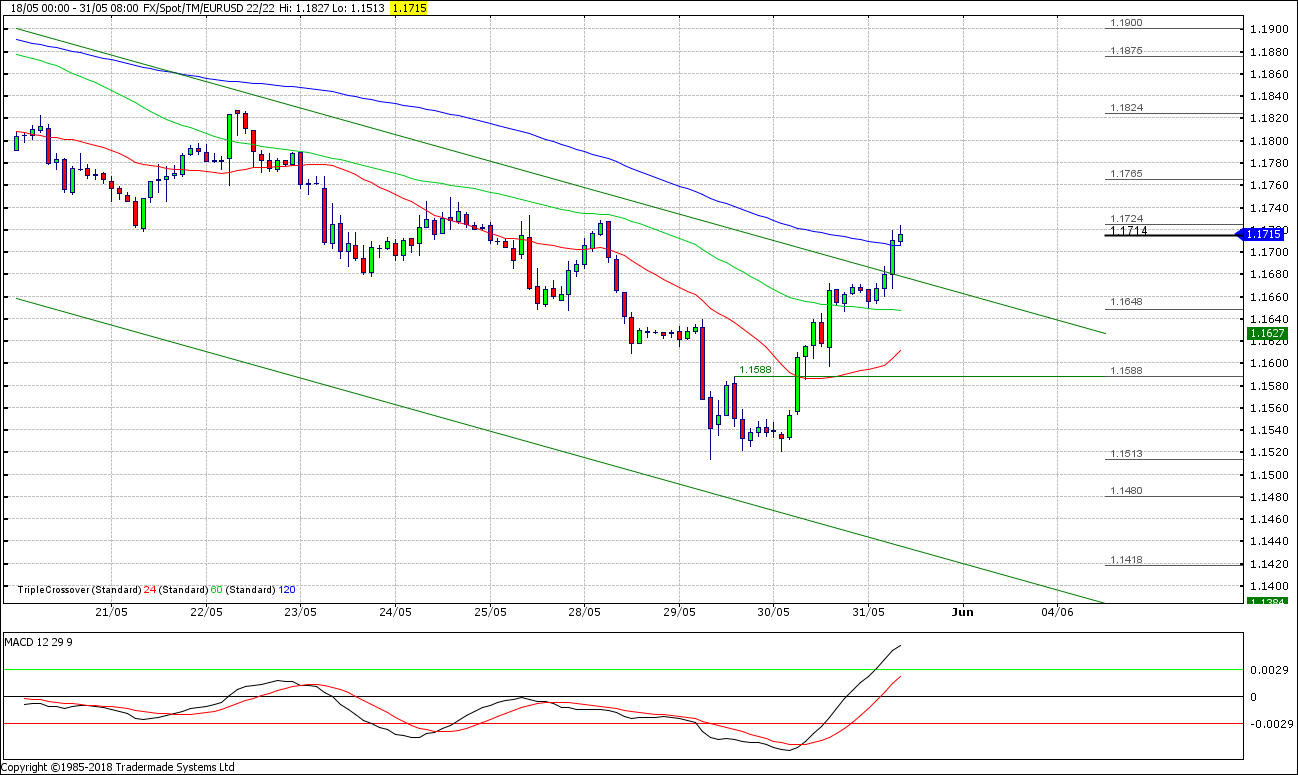
Strategy: Support at 1.1648 for 1.1824
Short-term view: EUR/USD has left a bullish engulfing candle on a daily chart, bear channel top has given way and moving averages have just started to rise. Hence, we see a rise to 1.1765, possibly 1.1824. Below 1.1648 to open 1.1588
GBPUSD Chart (Two-week)
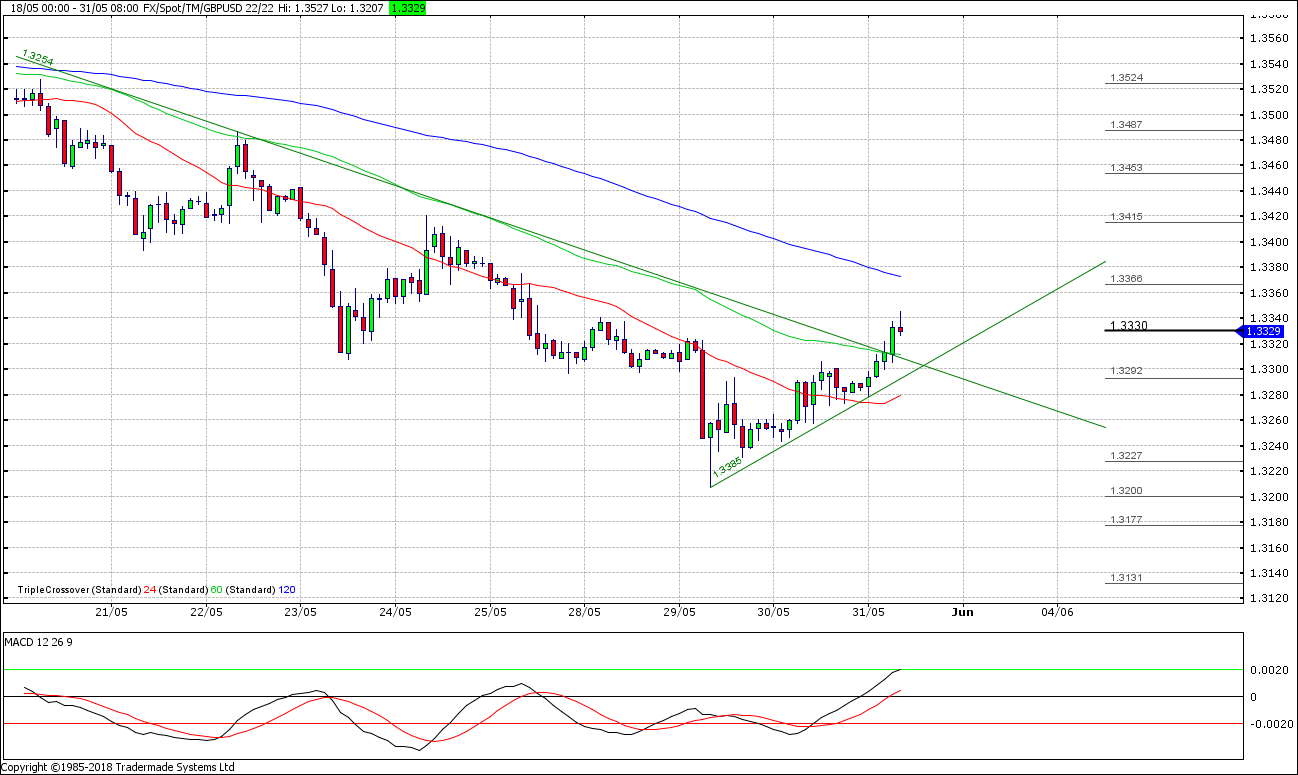
Strategy: Suppport at 1.3292 for 1.3415
Short-term view: GBP/USD has broken a downtrend and MACD has entered positive area. Hence, we see chances of a rise to 1.3366-1.3415. A break below 1.3292 to open 1.3227-1.3250 area.
USDJPY Chart (Two-week)
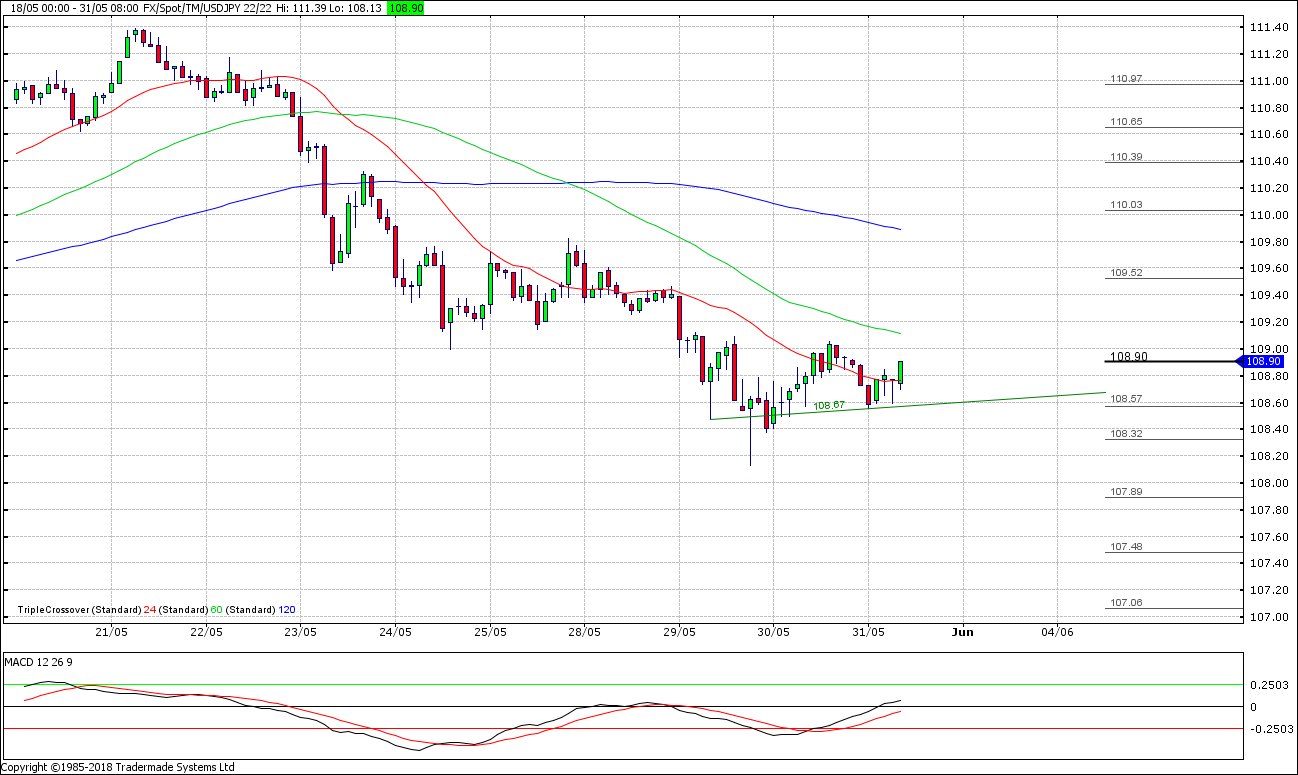
Strategy: Support at 108.57 for 109.52
Short-term view: USD/JPY has completed a bullish harami pattern on a daily chart and support line comes in at 108.57. Hence, we see likelihood of a rise to 109.52. A break below 108.57 to open 107.89
AUDUSD Chart (Two-week)
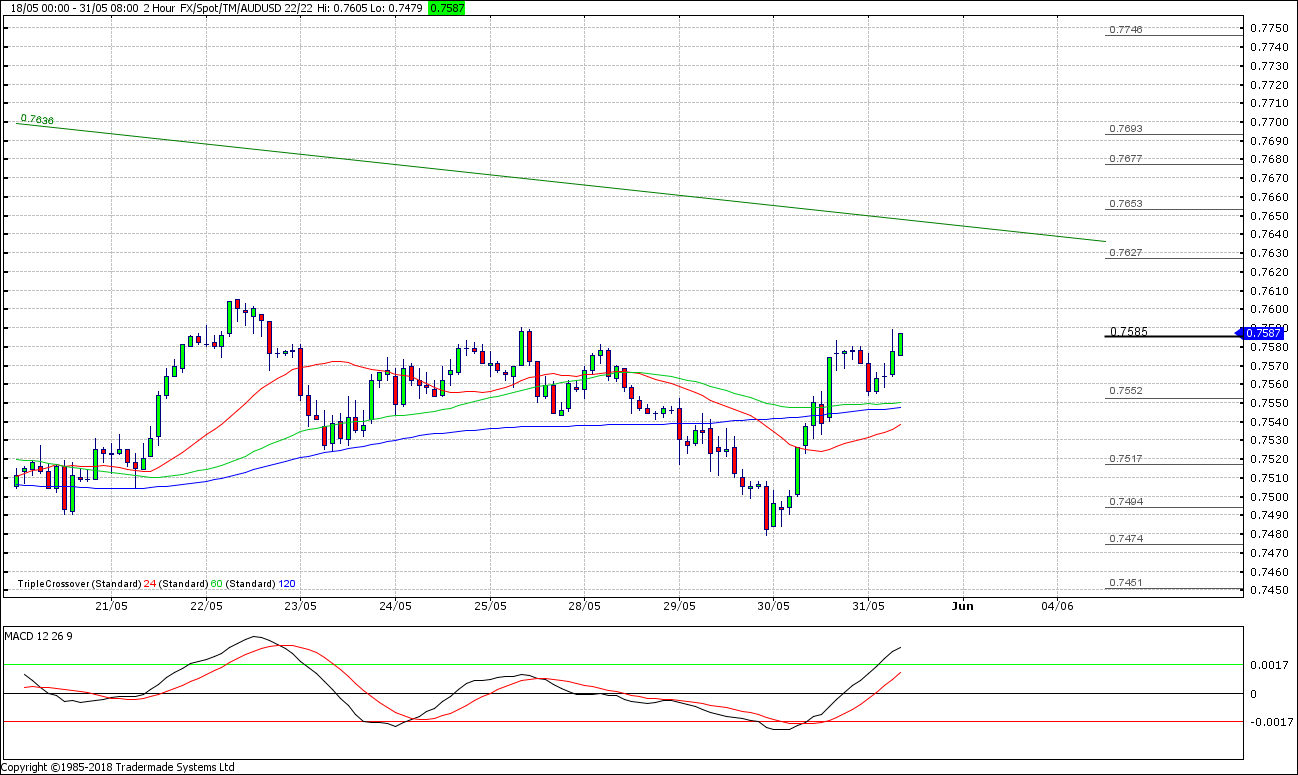
Strategy: Support at 0.7552 for .7627
Short-term view: AUD/USD has completed a bullish engulfing pattern and daily MACD has broken above the downtrend. Hence, we may see a rise to .7627. Below .7552 to open .7520
BTCUSD 4-Hour Chart (Two-month)
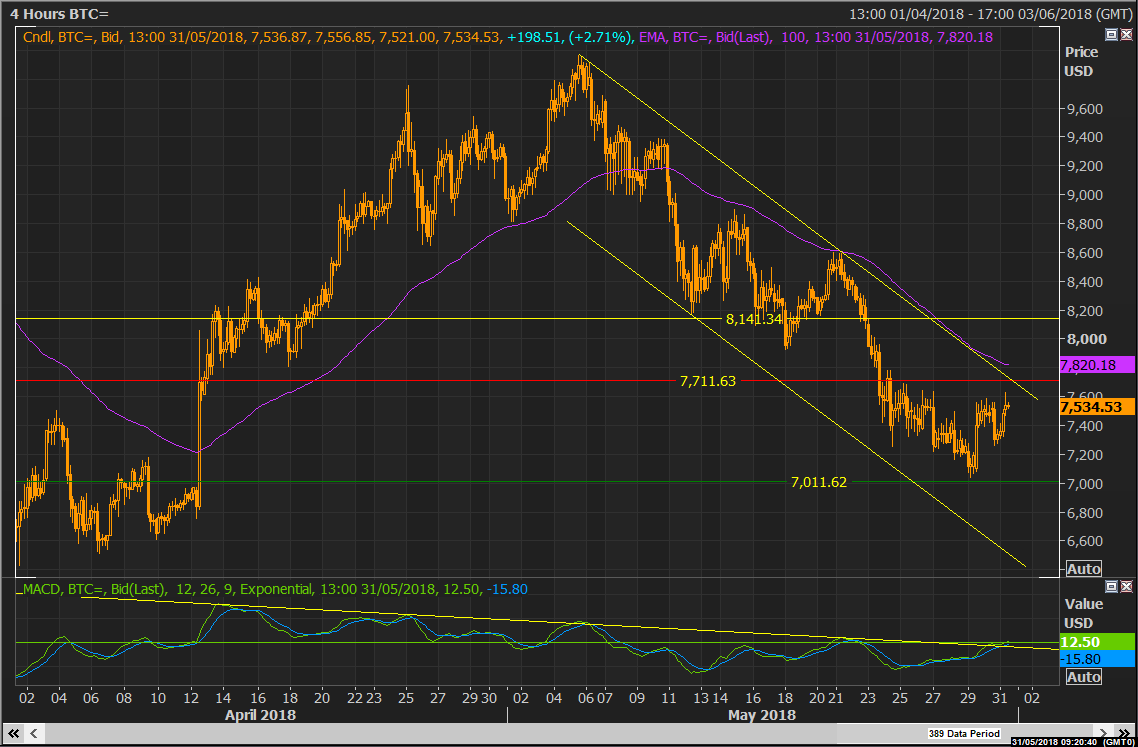
(Chart by Reuters)
Strategy: Resistance at $7711 for $7011
Short-term view: BTC/USD resistance exist at $7711, price action remains in a bear channel and MACD continues to move in a downtrend (some signs of a possible break). Hence, we see a dip to 7011. Above 7711 to open towards 8141.