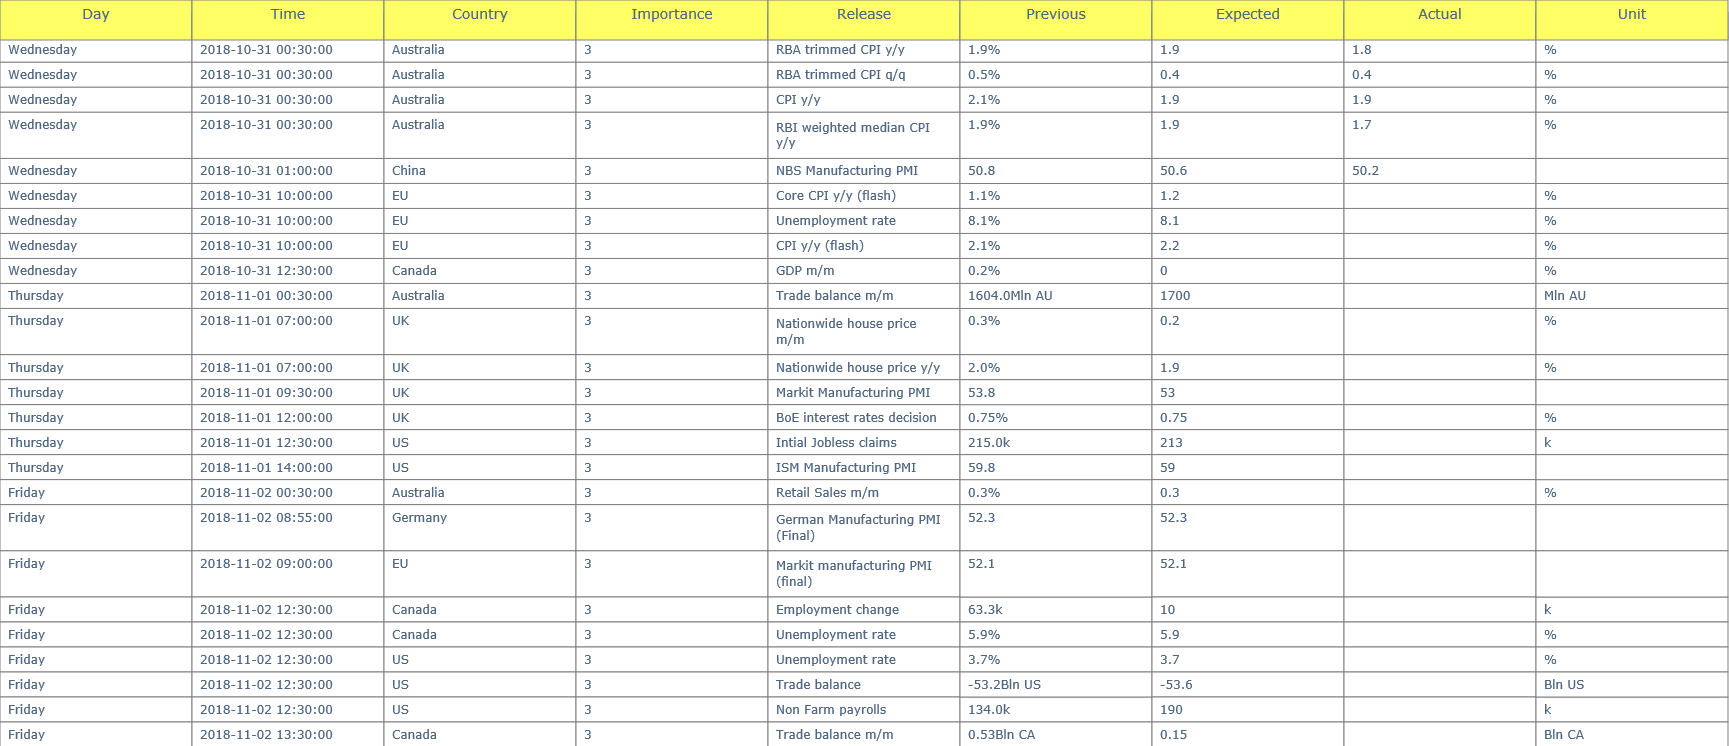
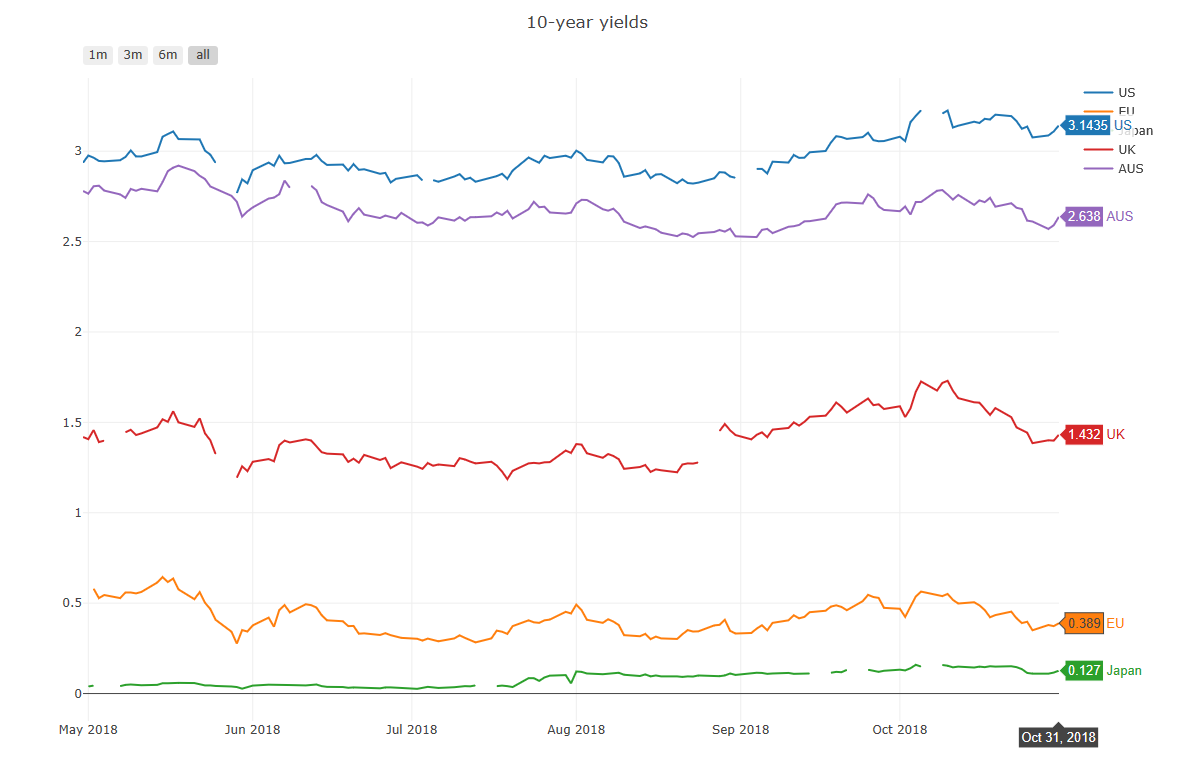
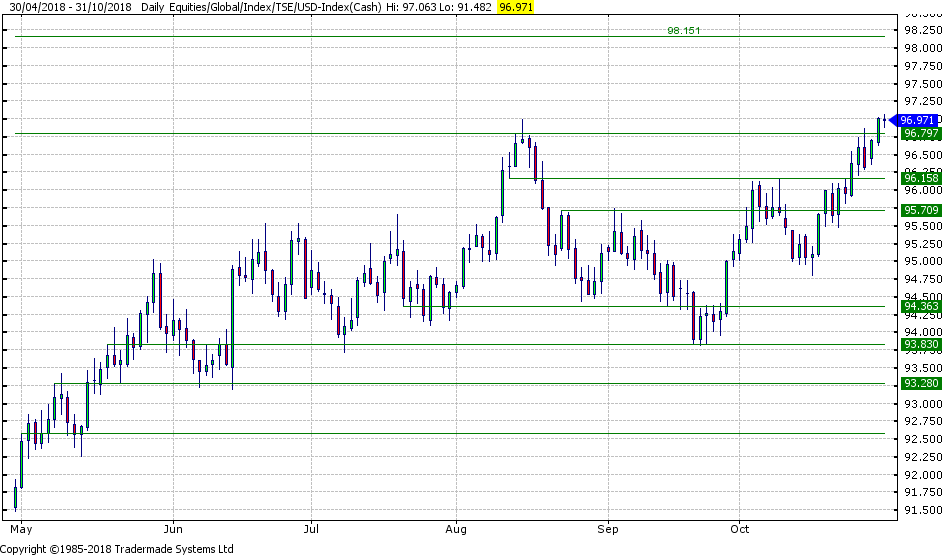
GBP and JPY are the top G10 FX gainers today, up 0.24% and -0.02% vs the dollar while AUD and NZD are the top losers, down -0.39% and -0.37% vs the dollar. The USD-index broke recent highs to reach 16-month peaks this was partially due to strong US data and partially due to weak Euro-area data. Japanese yen also weakened after the BoJ kept the policy rate unchanged and lowered its price forecast to reinforce its stance to keep stimulus programme for the time being. In the Asian equities space, the Nikkei 225 closed 2.16% higher at 21,920, Hang Seng closed +1.6% at 24979.69 and Kospi ended +0.74% at 2029.69. The European equities were trading firm with the FTSE up +1.61% at 7148.94, DAX up +1.46% at 11452.37, and CAC up +2.15% at 5085.63. In the rates market, global yields were trading firmer; the US 10-year yield was trading at 3.1435% and the Bund 10-year yield trading at 0.386%. In the energy space, the Brent (front month) is trading up (0.83%) for the day at $76.54.


Short-term view: EUR/USD support at 1.1332, RSI and MACD are bottoming and a small base may be forming. Hence, we see a bounce to 1.1410, possibly 1.1440. Below 1.1332 to open 1.1280.


Short-term view: GBP/USD support at 1.2693, MACD and RSI are both bottoming. Hence, we see a move higher towards 1.2808. While below 1.2808 we see risk of a dip to 1.2693, possibly 1.2641. Above 1.2808 to open 1.2851
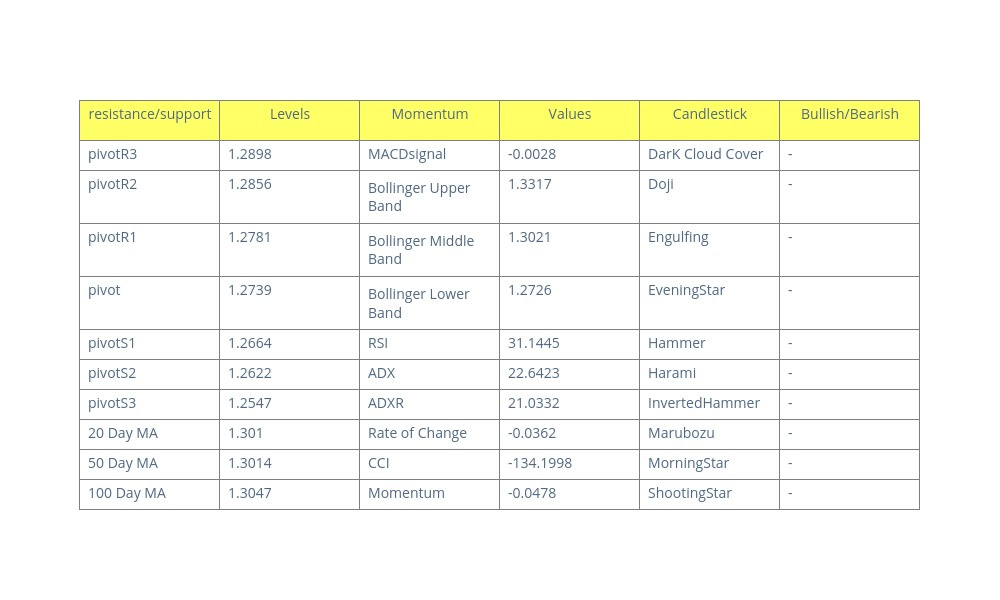
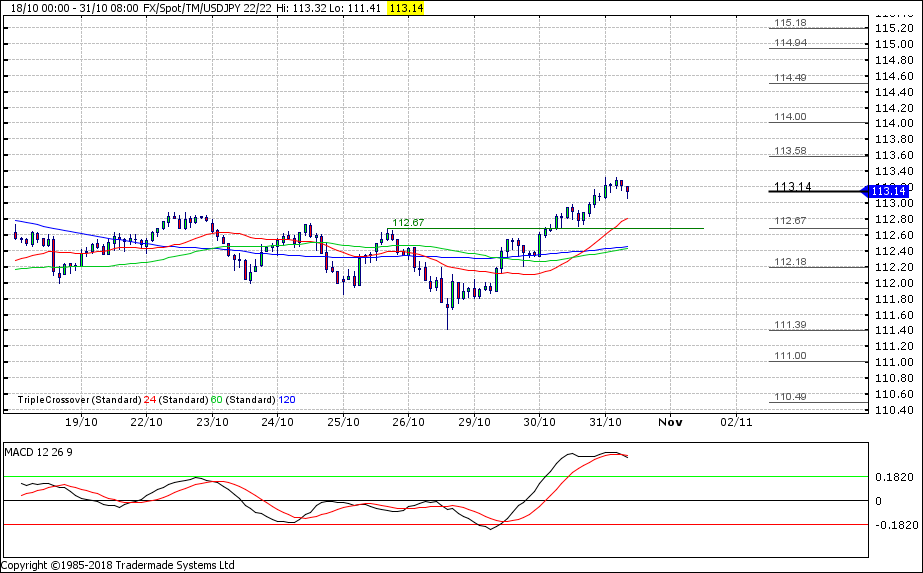
Short-term view: USD/JPY resistance at 113.58, MACD crossover suggets a bearish bias. Hence, we are likely to see a dip to 112.67. Above 113.58 to open 114.00


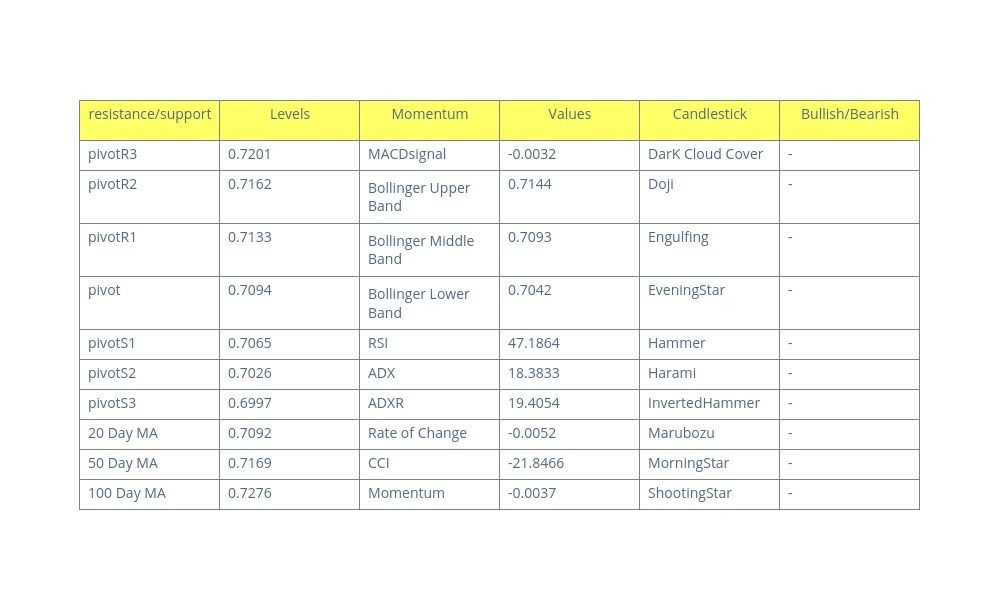
Short-term view: AUD/USD support at 0.7055, MACD and RSI are rising and bullish. Hence, we are likely to see a bounce to 0.7130, possibly .7160. Below 0.7055 to open .7018