


GBP/USD has been looking for a new direction as Prime Minister Boris Johnson contemplates the next steps in managing the coronavirus. crisis. How is the pound positioned?
The Technical Confluences Indicator is showing that cable faces fierce resistance at the 1.2451 to 1.2470 area. This cluster consists of the Bollinger Band 4h-Middle, the Pivot Point one-day Resistance 1, the Fibonacci 61.8% one-week, the Fibonacci 38.2% one-day, the Simple Moving Average 100-4h, the BB one-day Middle, and more.
Should the currency pair overcome this level, the next cap is at 1.2535, which is the convergence of the Fibonacci 23.6% one-month, the Fibonacci 38.2% one-week, and the Pivot Point one-day Resistance 3.
Support awaits at 1.2355, which is the confluence of the Fibonacci 61.8% one-week, the previous weekly low, and the PP one-week S1.
Further down, 1.2296 awaits GBP/USD. It is the meeting point of the PP one-month S1 and the BB one-day Lower,
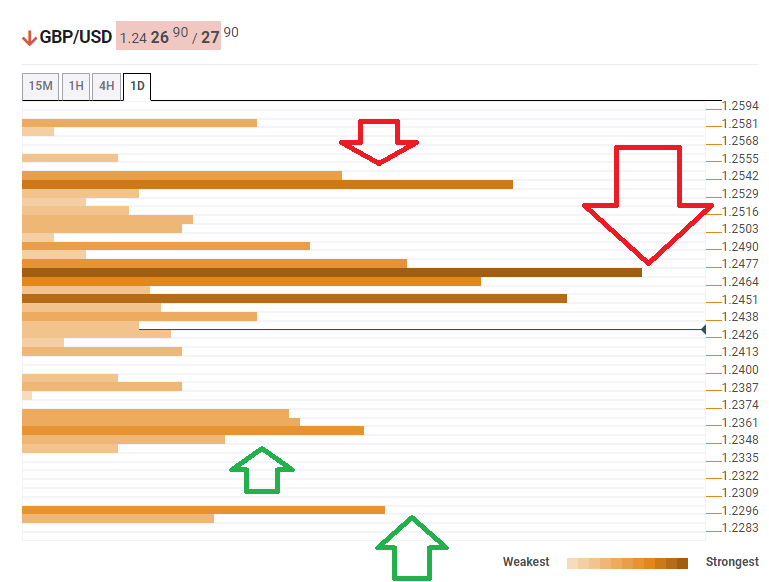
This is how it looks on the tool:
Confluence Detector
The Confluence Detector finds exciting opportunities using Technical Confluences. The TC is a tool to locate and point out those price levels where there is a congestion of indicators, moving averages, Fibonacci levels, Pivot Points, etc. Knowing where these congestion points are located is very useful for the trader, and can be used as a basis for different strategies.
This tool assigns a certain amount of “weight” to each indicator, and this “weight” can influence adjacents price levels. This means that one price level without any indicator or moving average but under the influence of two “strongly weighted” levels accumulate more resistance than their neighbors. In these cases, the tool signals resistance in apparently empty areas.
Learn more about Technical Confluence