- GBP/USD edges higher following a two-day uptrend to weekly top.
- 50% Fibonacci retracement guards immediate upside, 10-week-old horizontal area become the key support.
- Bulls remain hopeful amid upbeat until the quote stays beyond 61.8% Fibonacci retracement.
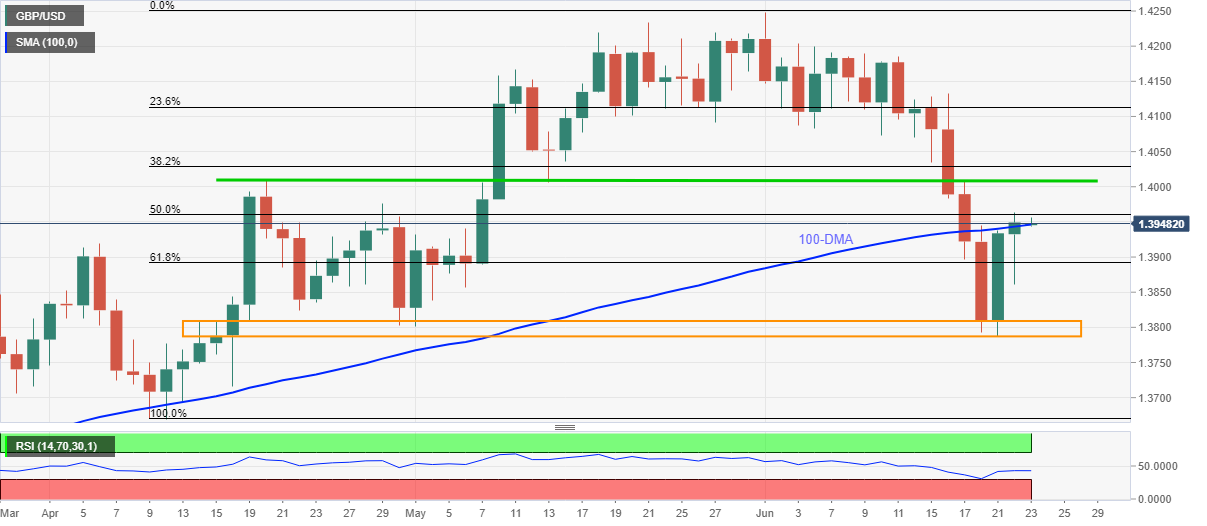
GBP/USD sellers attack intraday low near 1.3940, keeping choppy moves inside a 10-pips trading range, amid the Asian session on Wednesday. In doing so, the quote seesaws around 100-day SMA after rising for the last two consecutive days.
Considering the cable pair’s sustained trading above 61.8% Fibonacci retracement of April-June upside, amid recovering RSI, the weekly uptrend is likely to prevail, awaiting the monthly PMI data from the US and the UK.
However, the 50% Fibonacci retracement level near 1.3960 tests the intraday buyers ahead of the key horizontal resistance around 1.4005-10.
In a case where the GBP/USD buyers cross the 1.4010 hurdle, the 1.4100 threshold should return to the chart.
Meanwhile, pullback moves may aim for 61.8% Fibonacci retracement close to 1.3890 before eyeing the April 22 low near 1.3820. Though, any further declines will be challenged by the 1.3810–3790 region comprising multiple levels marked since mid-April.
Overall, GBP/USD remains in the recovery mode but bulls need fresh fuel to extend the run-up, which in turn emphasize on today’s activity numbers.
GBP/USD DAILY CHART