


- After recording its largest weekly decline since 1983 last week, XAU/USD has been consolidting this week.
- More sideways could be expect in the precious metal market.
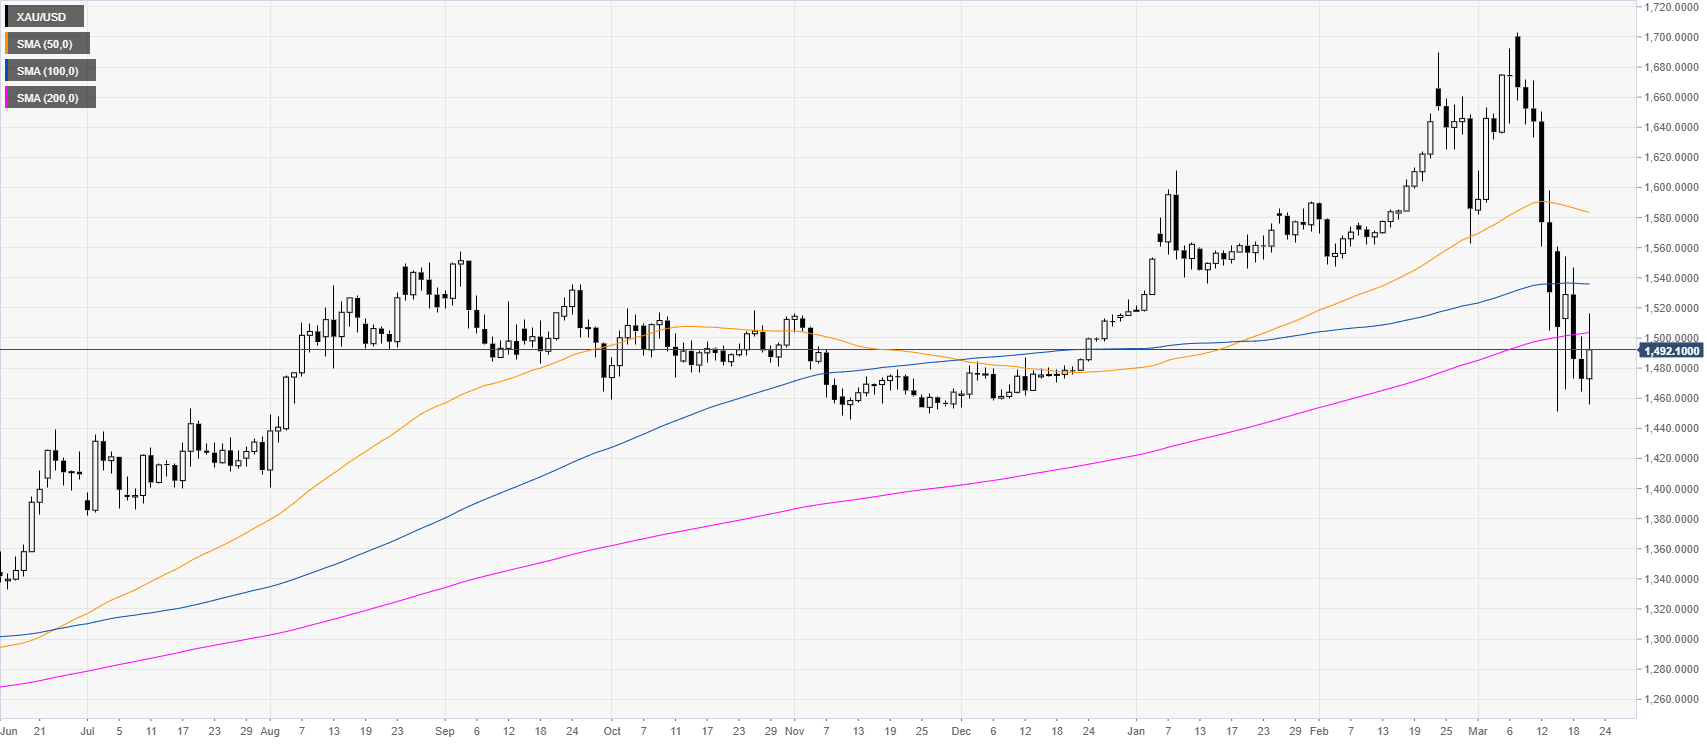
XAU/USD DAILY CHART
Last week, XAU/USD recorded its worst weekly decline since 1983, erasing the early 2020 bull-run while now challenging the 200 DMA (daily simple moving average) on the daily chart. XAU/USD keeps consolidating losses below $1500 per troy ounce.
XAU/USD four-hour chart
XAU/USD is consolidating the selloff below 1500 while trading well below the main SMAs suggesting an overall bearish bias in the medium term. Volatility is decreasing while the market might be declining in the short term towards the 1488, 1477 and 1460 levels which bulls might try to defend. On the flip side, bullish attempts should lose steam near 1505, 1520 and 1540 price levels.
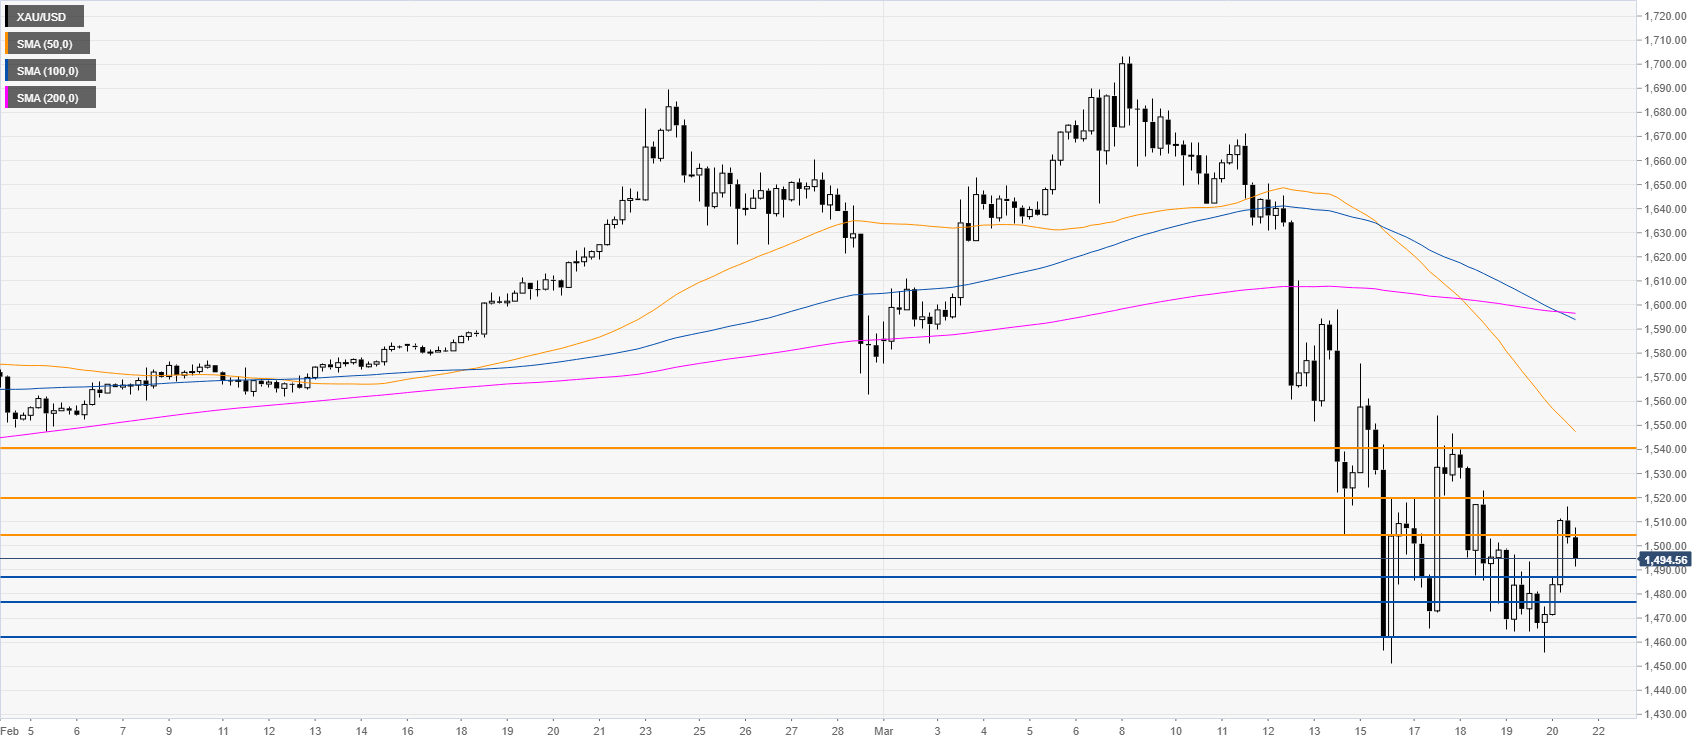
Resistance: 1505, 1520, 1540
Support: 1488, 1477, 1460