


Gold has been edging up above the $1,700 amid a cautious market mood. All eyes are on Jerome Powell, Chairman of the Federal Reserve. Will he open the door to more money printing?
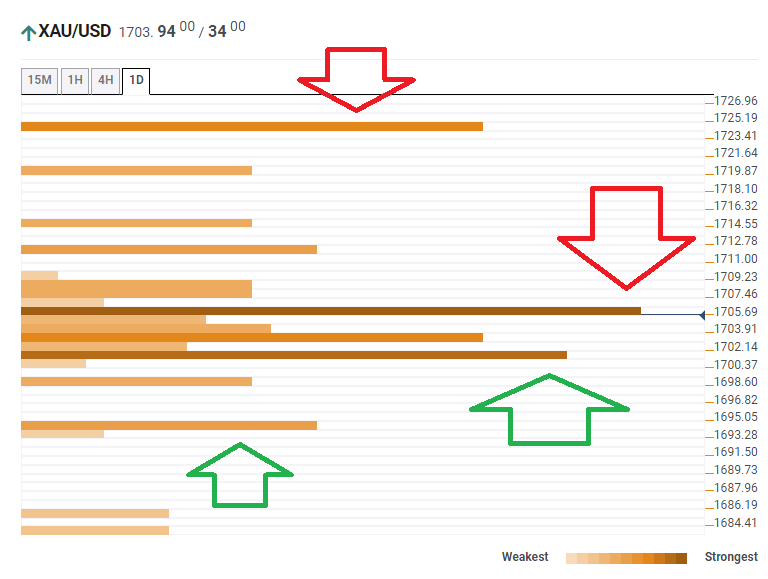
The Technical Confluences Indicator is showing that XAU/USD is struggling with $1,705, a dense cluster of lines including the Simple Moving Average 100-1h, the Bollinger Band one-day Middle, the SMA 100-4h, the Fibonacci 23.6% one-month, and the BB 15min-Upper.
If gold breaks higher, it has only a few hurdles on the way up to $1,724, which is where the previous weekly high and the Pivot Point one-week Resistance 1 converge.
Strong support awaits at $1,701, which is the meeting point of the Fibonacci 61.8% one-day, the previous 4h-Low, the SMA 5-one-day, the SMA 200-1h, the BB 15min-Lower, and the SMA 10-one-day.
Further down, the precious metal may find support at $1,694, which is the confluence of the previous daily low and the PP one-day Support 1.
Here is how it looks on the tool:
Confluence Detector
The Confluence Detector finds exciting opportunities using Technical Confluences. The TC is a tool to locate and point out those price levels where there is a congestion of indicators, moving averages, Fibonacci levels, Pivot Points, etc. Knowing where these congestion points are located is very useful for the trader, and can be used as a basis for different strategies.
This tool assigns a certain amount of “weight” to each indicator, and this “weight” can influence adjacents price levels. These weightings mean that one price level without any indicator or moving average but under the influence of two “strongly weighted” levels accumulate more resistance than their neighbors. In these cases, the tool signals resistance in apparently empty areas.
Learn more about Technical Confluence