


Gold has been on the rise after the Federal Reserve announced an open-ended Quantitative Easing program, providing cheap money to American firms and lifting markets. How is XAU/USD positioned on the technical charts?
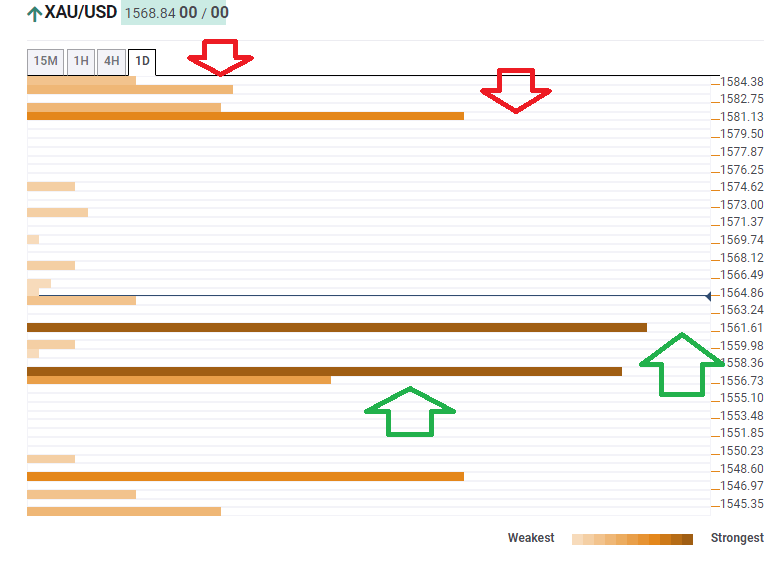
The Technical Confluences Indicator has no resistance levels up to $1,581, which is the convergence of the Pivot Point one-day Resistance 1 and the Fibonacci 23.6% one-month.
It is closely followed by $1,584, which is a weak resistance line. It includes the Simple Moving Average 100-4h, the Bollinger Band 15min-Upper, and the 50-day SMA.
Strong support awaits at $1,561, which is the confluence of the previous weekly high, the previous daily high, and the BB 15min-Lower.
Close by, another considerable cushion awaits at $1,557, where the PP one-week R1 converges with the previous year’s high.
Here is how it looks on the tool:
Confluence Detector
The Confluence Detector finds exciting opportunities using Technical Confluences. The TC is a tool to locate and point out those price levels where there is a congestion of indicators, moving averages, Fibonacci levels, Pivot Points, etc. Knowing where these congestion points are located is very useful for the trader, and can be used as a basis for different strategies.
This tool assigns a certain amount of “weight” to each indicator, and this “weight” can influence adjacents price levels. These weightings mean that one price level without any indicator or moving average but under the influence of two “strongly weighted” levels accumulate more resistance than their neighbors. In these cases, the tool signals resistance in apparently empty areas.