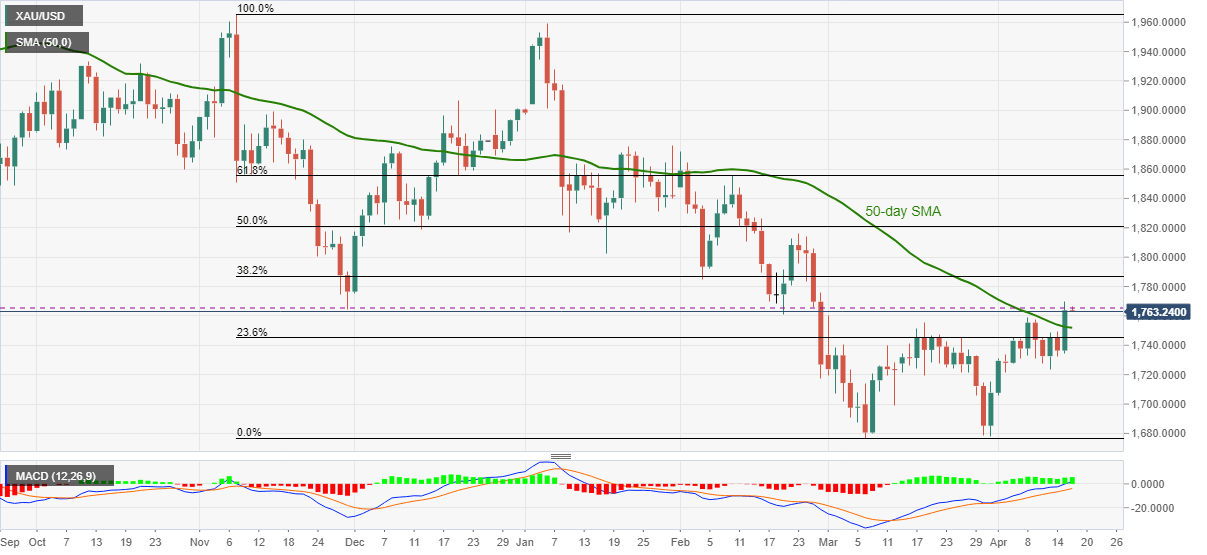
- Gold wobbles around late February top despite crossing 50-day SMA for the first time in three months.
- Bullish MACD favors bulls but a daily closing beyond November lows becomes necessary for further upside.
- 23.6% Fibonacci retracement offers extra support to watch during the pullback.
Gold slips below $1,764 in the latest pullback move during Friday’s Asian session. The yellow metal marked the heaviest gains in five weeks the previous day but couldn’t offer a daily closing beyond November 2020 lows near $1,765. Even so, the yellow metal keeps the 50-day SMA breakout portrayed the previous day.
As a result, the latest consolidation move may re-test the key SMA support around $1,752. Though, any further weakness will be questioned by the 23.6% Fibonacci retracement level of November 2020 to March 2021 downside, around $1,745.
In a case where the bullion sellers dominate past $1,745, the $1,720 and the $1,700 support levels may test the south-run towards the yearly bottom of $1,676.
Meanwhile, an upside break of the $1,765 hurdle could aim for a 38.2% Fibonacci retracement level near $1,787-88 before highlighting the $1,800 threshold for the bulls.
During the quote’s sustained run-up beyond $1,800, the late February tops near $1,816 will be the key to watch.
GOLD DAILY CHART