


- NZD/USD’s daily chart shows a bearish reversal pattern.
- Key indicators are alinged in favor of the bears.
NZD/USD’s daily line chart shows a head-and-shoulders breakdown, a bearish reversal pattern.
The breakdown confirmed last week indicates that the rally from the March low of 0.5469 has ended and the bearish have regained control. The pattern has created room for a sell-off to 0.6376 (target as per the measured move method).
Supporting the H&S breakdown is a below-50 or bearish reading on the 14-day relative strength index. The MACD histogram, too, is flashing a sell signal with a negative reading.
The pair is currently trading largely unchanged at 0.6527, having hit a high and low of 0.6539 and 0.6515 early Tuesday. A close above 0.6651 (July 19 high) is needed to put the bulls back into the driver’s seat.
DAILY CHART
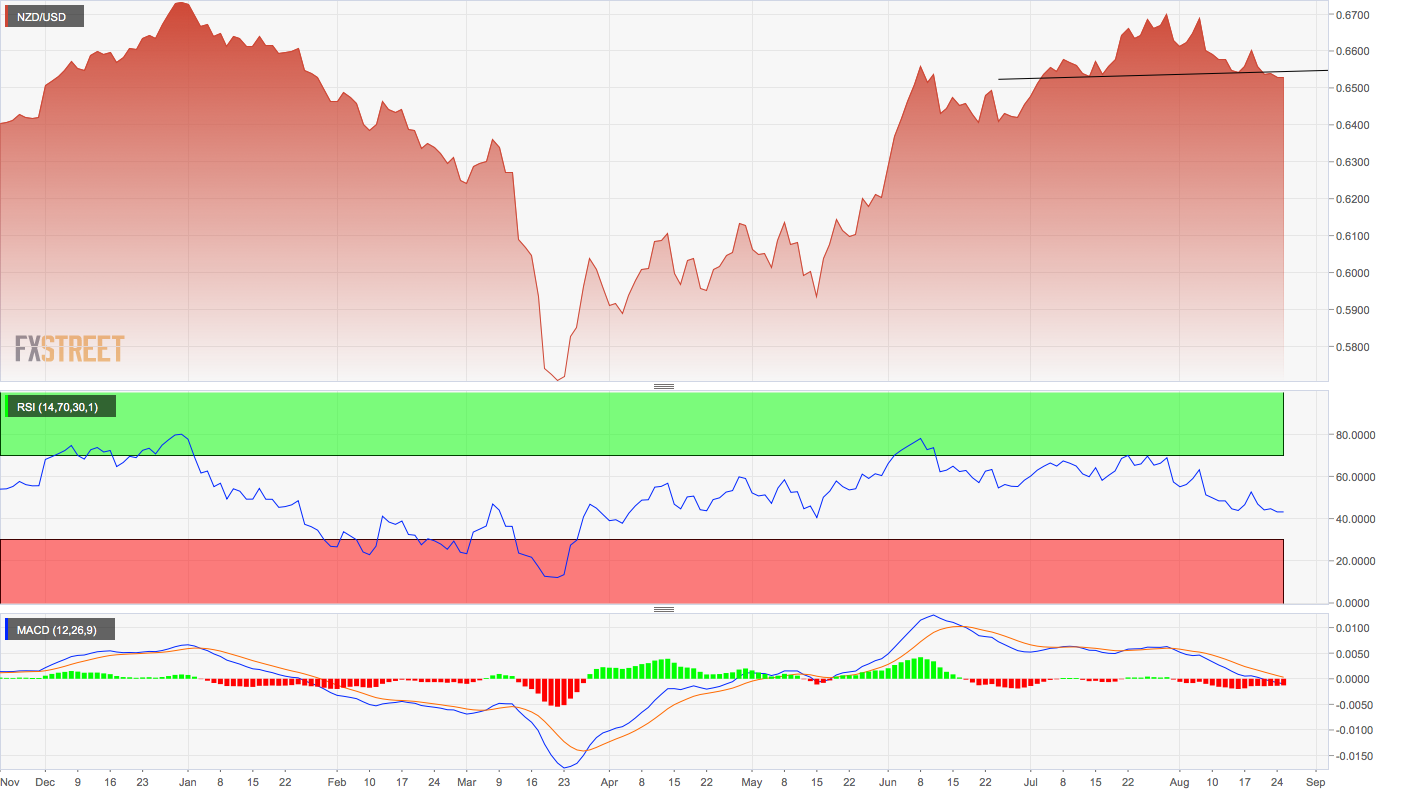
Trend: Bearish