


The S&P 500 Index has been extending its gains on Wednesday, amid optimism for a swift recovery based on a vaccine or cure to coronavirus. Can the rally continue? S&P 500 futures are edging lower on Thursday and one technical barrier stands out.
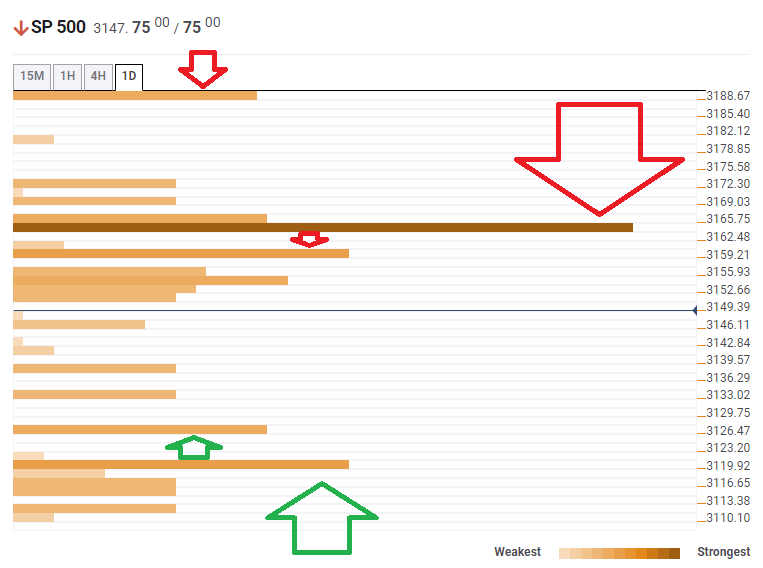
The Technical Confluences Indicator is showing that the S&P 500 Index is facing fierce resistance at 3,165, which is a dense cluster of lines including the Simple Moving Average 10-4h, the Fibonacci 23.6% one-month, the Fibonacci 23.6% one-day, and the previous weekly high.
Beyond this level, the upside target is 3,188, which is the convergence of the Pivot Point one-day Resistance 2 and the Bollinger Band 4h-Upper.
Below that level, another cap is 3,159, where the Bollinger Band 1h-Middle and the SMA 100-15m meet up.
Looking down, some support awaits at 3,126, which is where the Fibonacci 23.6% one-week hits the price.
Stronger support is at 3,119, which is the confluence of the Fibonacci 38.2% one-month and the BB 4h-Lower.
Here is how it looks on the tool:
Confluence Detector
The Confluence Detector finds exciting opportunities using Technical Confluences. The TC is a tool to locate and point out those price levels where there is a congestion of indicators, moving averages, Fibonacci levels, Pivot Points, etc. Knowing where these congestion points are located is very useful for the trader, and can be used as a basis for different strategies.
This tool assigns a certain amount of “weight” to each indicator, and this “weight” can influence adjacents price levels. These weightings mean that one price level without any indicator or moving average but under the influence of two “strongly weighted” levels accumulate more resistance than their neighbors. In these cases, the tool signals resistance in apparently empty areas.
Learn more about Technical Confluence