


The S&P 500 Index is on the rise as Chinese authorities have been encouraging a bull market and despite the increase in US coronavirus cases. After a long weekend, stocks are set to kick off the week on a positive note. How is it positioned on the charts?
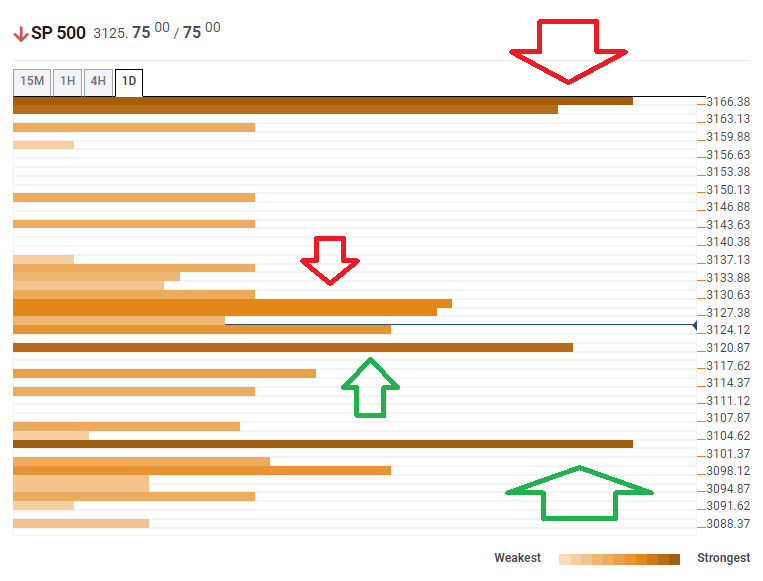
The Technical Confluences Indicator is showing that the S&P 500 Index faces initial resistance at around 3,128, which is the convergence of the Fibonacci 38.2% one-day, the previous 4h-high, and the Simple Moving Average 10-1h.
The upside target is 3,166, which is the meeting point of the Fibonacci 23.6% one-month, the Fibonacci 161.8% one-day high, and the previous weekly high.
Support is at 3,120, which is the confluence of the Fibonacci 38.2% one-month and the Bollinger Band 15min-Lower.
Further down, the next cushion is around 3,102, which is where the Fibonacci 38.2% one-week and the SMA 5-one-day converge.
Here is how it looks on the tool:
Confluence Detector
The Confluence Detector finds exciting opportunities using Technical Confluences. The TC is a tool to locate and point out those price levels where there is a congestion of indicators, moving averages, Fibonacci levels, Pivot Points, etc. Knowing where these congestion points are located is very useful for the trader, and can be used as a basis for different strategies.
This tool assigns a certain amount of “weight” to each indicator, and this “weight” can influence adjacents price levels. These weightings mean that one price level without any indicator or moving average but under the influence of two “strongly weighted” levels accumulate more resistance than their neighbors. In these cases, the tool signals resistance in apparently empty areas.
Learn more about Technical Confluence