


The S&P 500 Index has staged a late rally on Thursday, shrugging off concerns about record coronavirus cases in the US and the Federal Reserve’s dividend and buyout limits. How will stocks close the week?
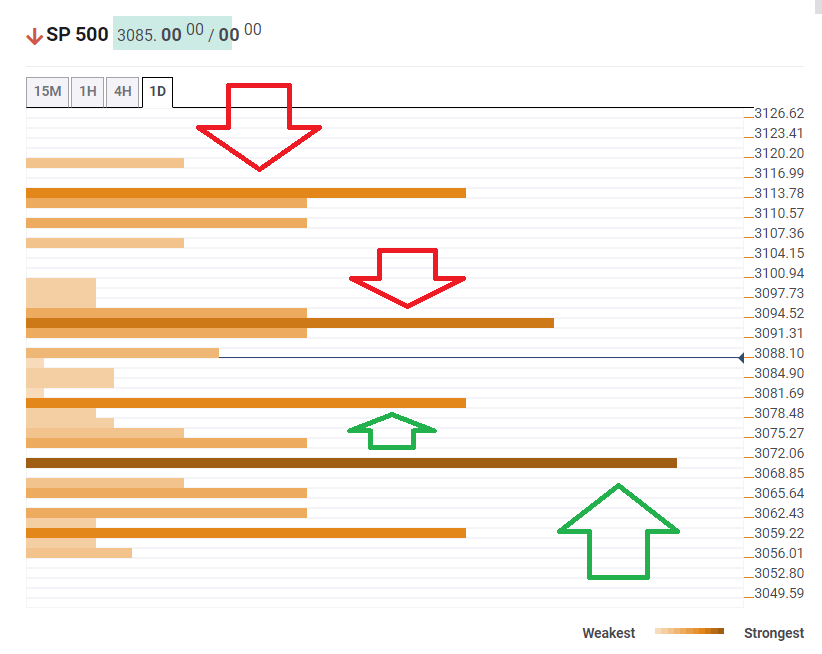
The Technical Confluences Indicator is showing that the S&P index has some support at 3,080, which is the convergence of the Fibonacci 38.2% one-week and the Simple Moving Average 50-1h.
Strong support awaits at 3,069, where the previous monthly high and the SMA 50-15m meet up.
Looking up, resistance awaits at 3,093, which is the confluence of the Bollinger Band 15min-Upper, the SMA 5-one-day, the BB 4h-Middle, and the SMA 10-one-day.
Further above, the upside target is 3,113, which is where the Fibonacci 23.6% one-week and the Pivot Point one-day Resistance 1 converge.
Here is how it looks on the tool:
Confluence Detector
The Confluence Detector finds exciting opportunities using Technical Confluences. The TC is a tool to locate and point out those price levels where there is a congestion of indicators, moving averages, Fibonacci levels, Pivot Points, etc. Knowing where these congestion points are located is very useful for the trader, and can be used as a basis for different strategies.
This tool assigns a certain amount of “weight” to each indicator, and this “weight” can influence adjacents price levels. These weightings mean that one price level without any indicator or moving average but under the influence of two “strongly weighted” levels accumulate more resistance than their neighbors. In these cases, the tool signals resistance in apparently empty areas.
Learn more about Technical Confluence