


- USD/INR eases from the intraday high of 73.69.
- 200-day SMA probes candlestick suggesting another run-up to one-month high.
- Fresh selling can wait for breaking Friday’s low.
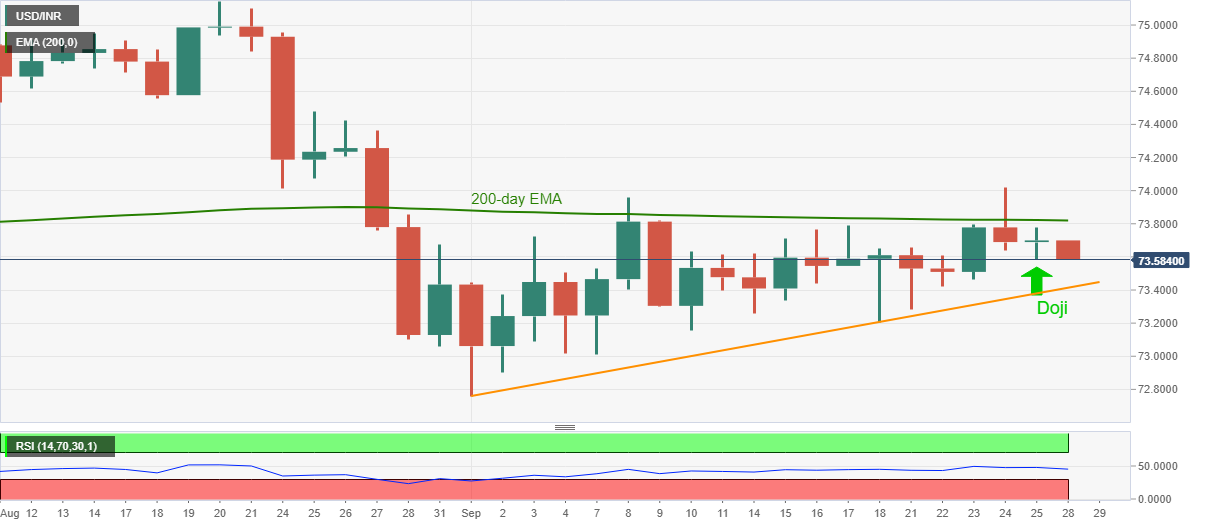
USD/INR drops to 73.59, down 0.15% intraday, during the initial Indian session on Monday. In doing so, the pair defies Friday’s Doji candlestick on the daily chart that suggests a bullish move following the Thursday’s pullback from the monthly high.
However, the bears need a clear break of Friday’s low of 73.58 to defy the bullish candlestick formation and attack an upward sloping trend line from September 01, at 73.41.
Should USD/INR sellers conquer 73.41 on a daily closing, the September 18 low of 73.20 can offer an intermediate drop towards the 73.00 round-figures and then to the monthly bottom surrounding 72.75.
Meanwhile, an upside clearance of the 200-day EMA level of 73.82 needs to cross the 74.02 level, comprising the current month’s peak, to regain the buyers’ confidence.
In that case, the USD/INR bulls may target the August 25 top close to 74.50 during further upside.
USD/INR DAILY CHART
Trend: Pullback expected