


- USD/INR respected bullish candlestick formation to stay beyond 74.50 the previous day.
- Nearly oversold RSI, short-term support line offer extra challenges to the sellers.
- An upside clearance of 75.27 will accelerate the recovery moves, late-March lows will follow the nearby support lines.
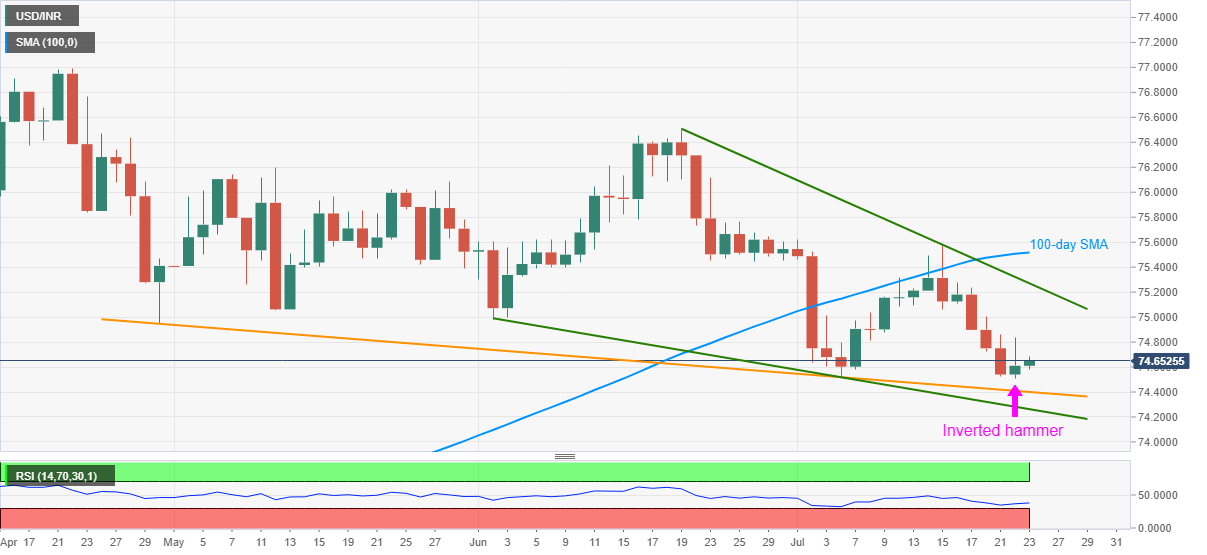
USD/INR trades around 74.65 as the Indian session opens on Thursday. The pair’s previous two-day gains could be traced to inverted hammer bullish candlestick formation on the daily chart. Also supporting the buyers are RSI conditions and nearness to the key support lines from April-end and early-June.
As a result, the bulls can aim for the June 02 bottom surrounding 75.00 during the further upside, a break of which will escalate the pair’s pullback towards a falling trend line from June 19, at 75.27.
It should, however, be noted that the pair’s run-up past-75.27 will confirm a seven-week-old rising wedge formation, which in turn can challenge June month’s peak of 76.50. Though, 100-day SMA close to 75.51 may offer an intermediate halt.
On the downside, the pair’s break below 74.50 will negate the bullish candlestick formation but further weakness will be confined by a downward sloping trend line from April 30, at 74.40 now.
Additionally, the lower line of the said rising wedge formation, at 74.25, will add filters to the quote’s extra south-run past-74.40.
USD/INR daily chart
Trend: Further recovery expected