


Dollar/yen has been making its way higher amid a better market mood. Can it continue rising? The technical positioning suggests more gains are possible.
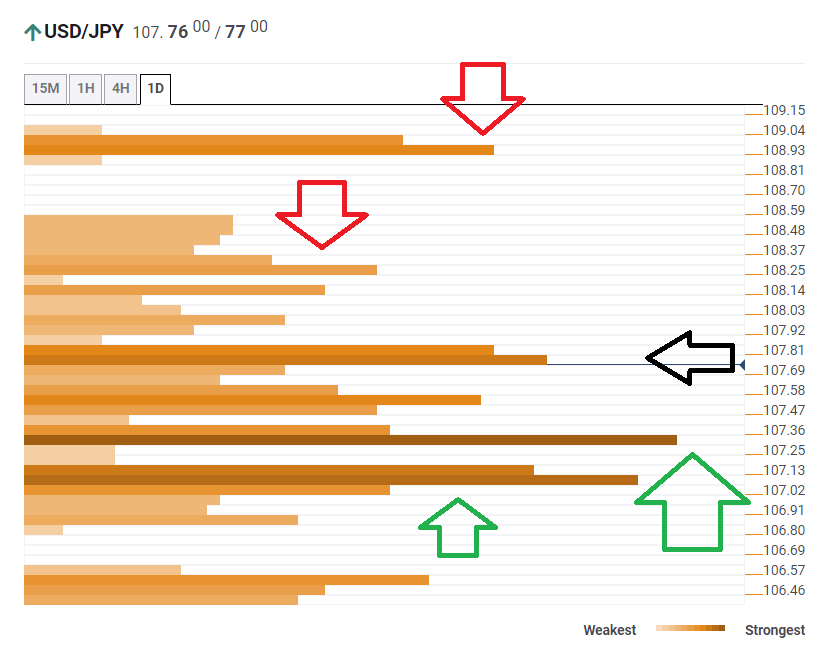
The Technical Confluences Indicator is showing that USD/JPY is struggling at around 107.75, which is a cluster including the Pivot Point one-week Resistance 1, the previous 4h-Low, the Bollinger Band 15min-Lower, the Simple Moving Average 5-15m, the SMA 501h, the 50-day SMA, the Fibonacci 38.2% one-day, and more.
Soft resistance awaits at 108.25, which is the meeting point of the Fibonacci 61.8% one-month and the 200-day SMA.
The upside target is 108.93, which is a juncture of lines including three pivot points: the one-day R3, the one-month R1, and the one-week R3.
Strong support awaits at 107.30, which is a confluence including the SMA 5-one-day, the Fibonacci 38.2% one-week, and the previous daily low.
The next significant cushion is at around 107.08, which is where the SMA 10-one-day, the BB one-day Middle, and the Fibonacci 23.6% one-month converge.
Here is how it looks on the tool:
Confluence Detector
The Confluence Detector finds exciting opportunities using Technical Confluences. The TC is a tool to locate and point out those price levels where there is a congestion of indicators, moving averages, Fibonacci levels, Pivot Points, etc. Knowing where these congestion points are located is very useful for the trader, and can be used as a basis for different strategies.
This tool assigns a certain amount of “weight” to each indicator, and this “weight” can influence adjacents price levels. These weightings mean that one price level without any indicator or moving average but under the influence of two “strongly weighted” levels accumulate more resistance than their neighbors. In these cases, the tool signals resistance in apparently empty areas.
Learn more about Technical Confluence