


- USD/JPY drops to five-day low while extending Monday’s pullback from a 10-week top.
- 100-bar SMA, 50% Fibonacci retracement can question immediate downside.
- A one-month-old support line, 61.8% Fibonacci retracement and 200-bar SMA stand tall to challenge sellers.
- Buyers may wait for entries beyond 108.85 to question the recent high.
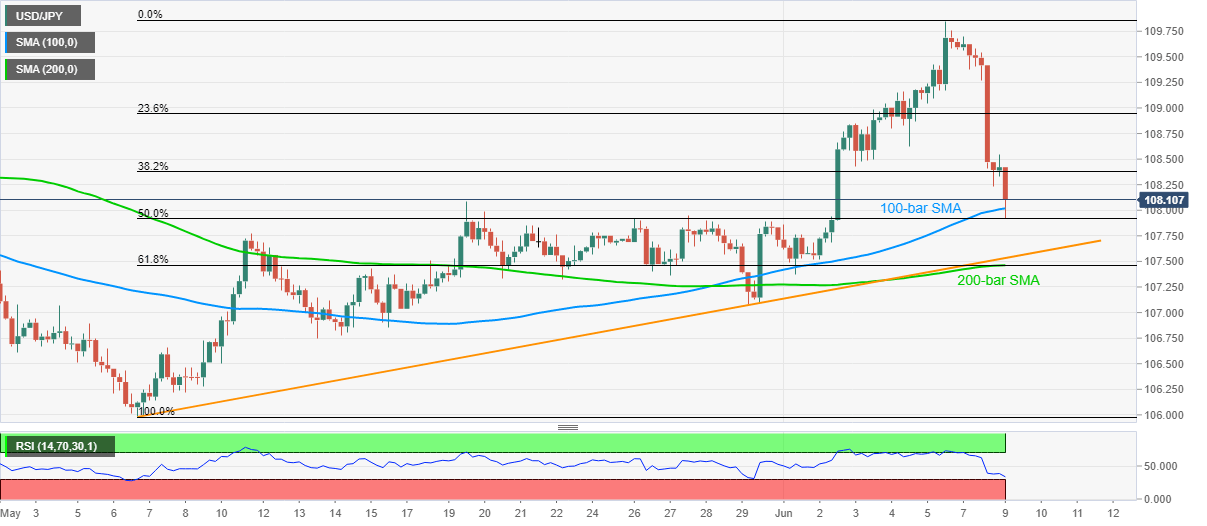
USD/JPY prints 0.28% loss on a day while declining to 108.13 during the early Tuesday. The pair recently dropped below 100-bar SMA, to 107.92, but oversold RSI conditions might have triggered its pullback from 50% Fibonacci retracement of May-June upside.
Having said that, the buyers are less likely to take fresh positions unless witnessing a clear break above 108.85, comprising multiple high/low marked last Wednesday and Thursday.
In doing so, the pair traders may aim to refresh the monthly high beyond 109.85 while looking towards 110.00 round-figure.
Alternatively, a clear break below 100-bar SMA and 50% Fibonacci retracement, respectively near 108.00 and 107.90, can fetch the USD/JPY prices to an ascending trend line from May 06, at 107.53 now.
It should, however, be noted that the pair’s additional weakness past-107.53 may find it difficult to sustain as 200-bar SMA and 61.8% Fibonacci retracement offer strong support around 107.50/45.
USD/JPY four-hour chart
Trend: Pullback expected