


- WTI prints two-day losing streak while keeping downside break of monthly support line and 21-day SMA.
- 50-day SMA appears next on the bears’ radars.
- Bulls will have a bumpy road unless refreshing the monthly top.
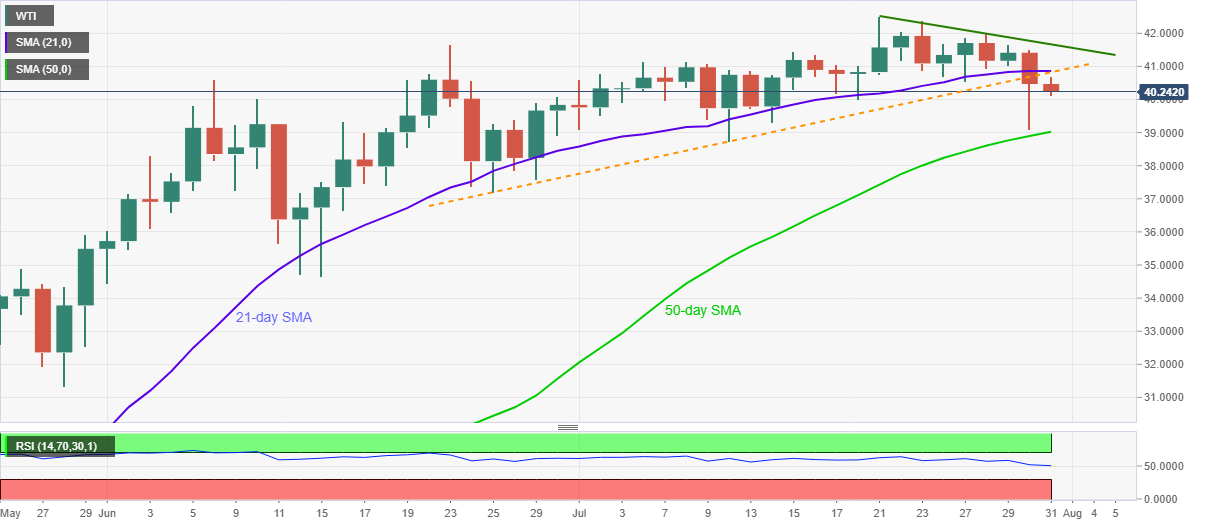
WTI drops to $40.16, down 0.76% on a day, while heading into the European open on Friday. The energy benchmark dropped below the key $40.85/80 support confluence, now resistance, comprising 21-day SMA and an ascending trend line from June 25.
The fall gains support from downward sloping RSI, which in turn directs the quote towards a 50-day SMA level of $39.00. However, the $40.00 threshold may offer an intermediate halt during the declines.
In a case where the black gold keeps trading southward past-$39.00, June 25 low near $37.20 and the mid-June bottom surrounding $34.60 will be in the spotlight.
Meanwhile, an upside clearance of the support-turned-resistance around $40.85 will need confirmation from $41.00 to attack a downward sloping trend line from July 21, at $41.65 now.
If at all oil prices rally past-$41.65 on a daily closing basis, the multi-day high, flashed on July 21, around $42.50, will hold the gate for the run-up towards February month low near $44.00.
WTI daily chart
Trend: Bearish