


- WTI stays on recovery mode above $40.00 after Friday’s choppy session.
- A horizontal area around $40.80 offers immediate resistance.
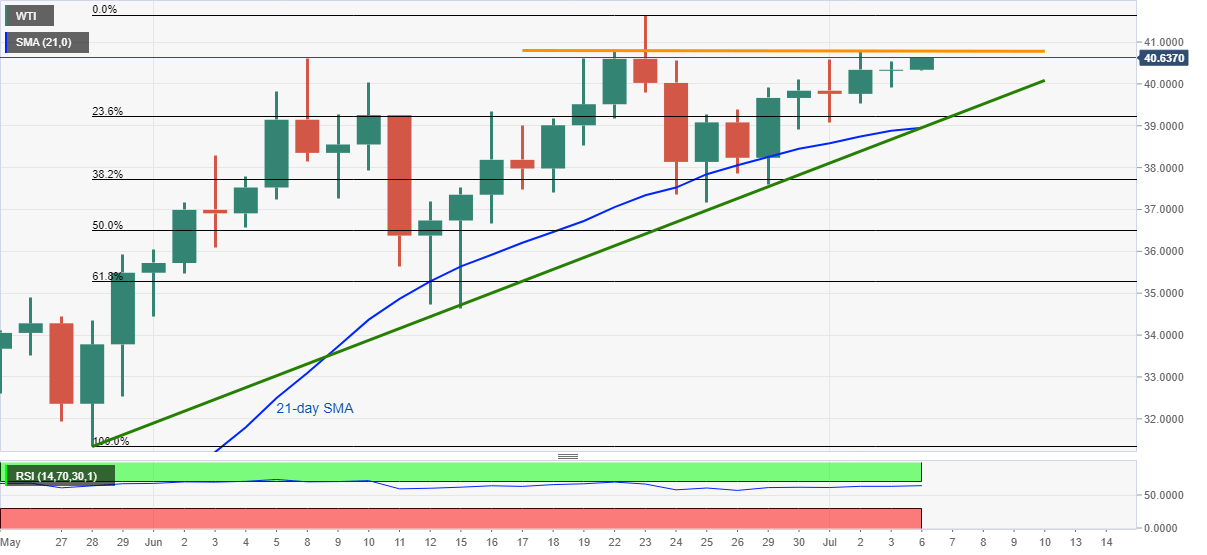
- The confluence of 21-day SMA, five-week-old support line becomes the tough nut to crack for sellers.
WTI takes the bids to $40.60, up 0.68% on a day, while heading into the European on Monday. The energy benchmark defies Friday’s Doji formation, suggesting a pullback while resuming Thursday’s run-up.
In doing so, a horizontal resistance comprising highs marked on June 22 and July 02, around $40.80, followed by $41.00 round-figures, might offer immediate resistance to the quote.
However, a clear break beyond $41.00 will quickly piece the June month top surrounding $41.60 to aim for February lows close to $44.00.
Meanwhile, a $39.90 mark comprising Friday’s low and June 29 top can question the black gold’s short-term losses ahead of the key $38.95/90 support confluence including 21-day SMA and an ascending support line from May 28.
If at all the bears sneak in around $38.90, bears may look at $37.00 as an intermediate halt during the fall towards $34.60, close to the mid-June bottom.
WTI daily chart
Trend: Bullish