


TRADING SPOTLIGHT
Every day we analyze the market trends, select the most newsworthy asset, and prepare technical analysis on it—to help you reduce risks and get prepared.
- ALL
- NZDUSD
- USDCAD
- XBRUSD
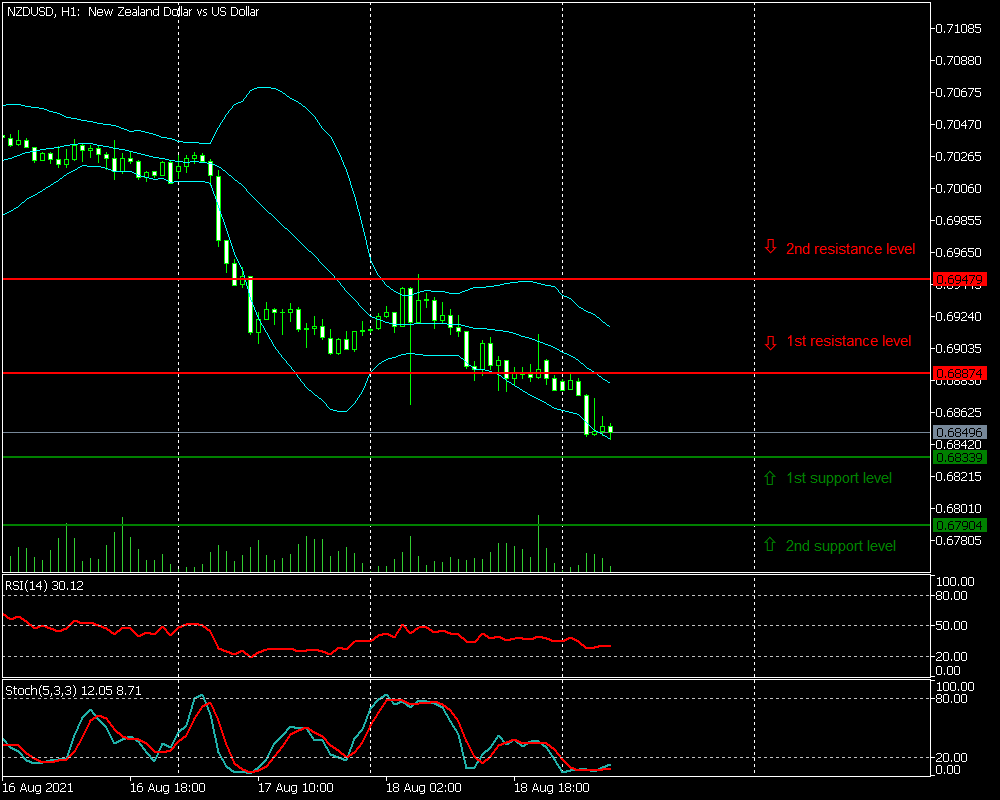
Pay attention to NZDUSD
What happened earlier
NZDUSD declined towards 0.68400 because the U.S. dollar rose to a nine-month high versus the New Zealand currency. The greenback’s surge that happened after Fed minutes showed that the policymakers mostly agreed on starting a stimulus taper this year.
What the picture is now
The Bollinger Bands indicate moderate volatility and show bearish sentiment. The RSI, which is under 50, displays a prevailing downtrend while the Stochastic suggests a possible upwards correction.
What the possible outcomes are
- In our most likely scenario, the NZDUSD pair may experience a downwards correction towards the first support level of 0.68339.
- If the pair falls below the first support level, we can expect a continued downtrend towards the second support level of 0.67904.
- Contrarily, the pair may rise towards the first resistance level of 0.68874.
- If the pair surpasses the first resistance level, we should expect a continued surge towards the second resistance level of 0.69479.
Keep USDCAD in sight

What happened earlier
USDCAD rose to 1.27050 upon the U.S. dollar strengthening. The Fed minutes supported the greenback as traders saw that the central bank was on track to taper this year. At the same time, oil prices fell on demand fears and weakened the CAD.
What the picture is now
The wide-open Bollinger Bands indicate increased volatility. The RSI, which is close to 80, and the Stochastic suggest a possible correction downwards with a prevailing uptrend.
What the possible outcomes are
- In our most likely scenario, the USDCAD pair may rise towards the first resistance level of 1.27050.
- If the pair can advance beyond the first resistance level, then the next logical move is to the second resistance level of 1.27745.
- Conversely, it’s possible to see the pair fail to break the first resistance level and regress towards the first support level of 1.26400.
- If the pair falls below the first support level, we can expect a further decline to the second level of 1.25802.
Stay aware of the XBRUSD movement

What happened earlier
XBRUSD fell to 66.71 as oil prices dramatically declined on investors’ fears about a fuel demand drop while COVID-19 cases surge worldwide. Several countries have re-introduced travel restrictions, and air traffic has softened in recent weeks. According to U.S. Energy Department figures, U.S. crude inventories fell from 3.2 million barrels last week to 435.5 million barrels, their lowest since January 2020.
What the picture is now
The widely spread Bollinger Bands sugest increased volatility. The RSI, close to 20, and the Stochastic indicate a possible upward correction with a prevailing downtrend.
What the possible outcomes are
- In the most likely scenario, the XBRUSD pair may challenge the first support level of 66.71.
- If the pair falls below the first support level, we can expect a further decline to the second support level of 65.81.
- Contrarily, the pair may rise towards the first resistance level of 67.91.
- If the pair surpasses the first resistance level, we should expect a continued surge towards the second resistance level of 69.49.
Please note! This is not a direct instruction on which order to open. When applying this information, you remain solely responsible for the decision you make and financial risks you take.