US DOLLAR INDEX PRICE ANALYSIS: BULLS EYE 97.00 INSIDE TWO-WEEK-OLD RISING CHANNEL
- DXY seesaws around fresh 16-month high after two-day uptrend.
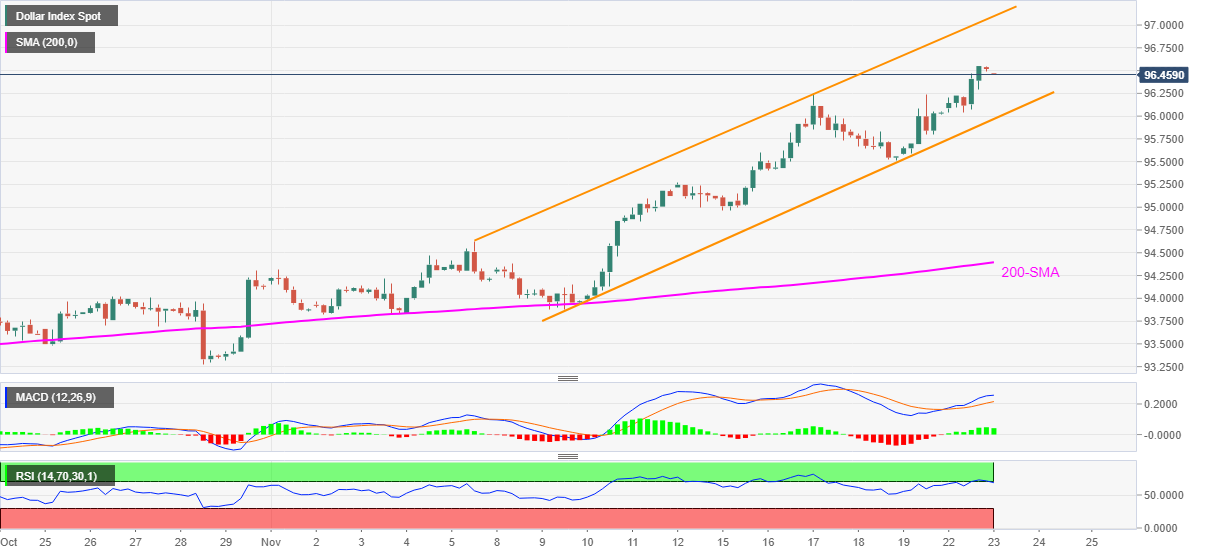
- Bullish chart pattern, MACD conditions keep buyers hopeful.
- Sellers remain cautious until the quote stays beyond 200-SMA.
US Dollar Index (DXY) grinds higher around the highest levels since July 2020, near 96.50 during Tuesday’s Asian session. The greenback gauge refreshed the multi-day top during the latest run-up amid firmer Treasury yields.
In doing so, the DXY remains inside a two-week-old rising channel bullish formation amid firmer MACD signals, which in turn suggests the quote’s additional upside.
It should be noted, however, that overbought RSI conditions may trigger intermediate pullbacks during the run-up to the stated channel’s upper line, close to the 97.00 threshold.
If DXY bulls keep the reins past 97.00, the June 2020 peak of 97.80 will be in focus.
Alternatively, pullback moves remain elusive until the quote stays beyond the channel’s support line of 95.95, a break of which will direct the bears towards the early November tops near 94.60.
Even so, the 200-SMA level of 94.40 acts as a tough nut to crack for the US Dollar Index bears.
DXY: FOUR-HOUR CHART