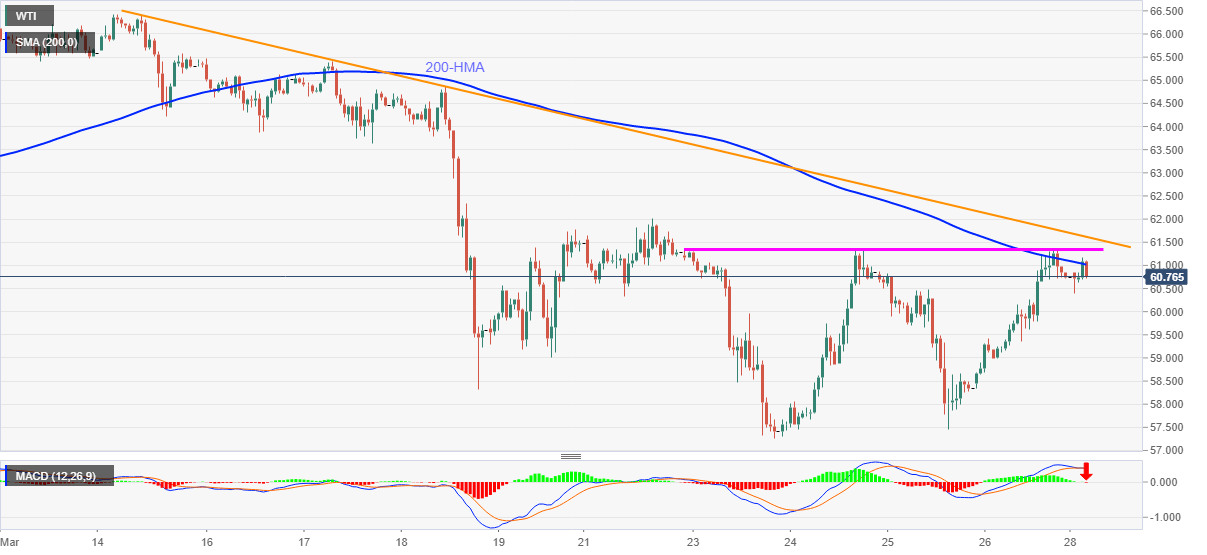
- WTI takes a U-turn from the key SMA to reverse intraday gains.
- One-week-old horizontal area and a bit broader falling trend line add to the upside barriers.
- $60.00 can test short-term sellers, further downside can eye the monthly low.
WTI marks another failure in crossing the 200-HMA while easing to $60.78 during early Monday. In doing so, the energy benchmark reverses the early Asian gains as MACD teases bears.
Given the black gold’s repeated failures to cross 200-HMA, not to forget multiple pullbacks from $61.35-30, WTI prices are likely to revisit the $60.00 threshold during the latest weakness.
However, any further downside may not refrain from attacking the $58.60 and $58.00 support levels but the monthly low of $57.27 can challenge the bears afterward.
Alternatively, an upside clearance of 200-HMA, at $61.00, will not only have to cross the stated immediate horizontal area around $61.35-30 but also clear a downward sloping trend line from March 15, at $61.65, to recall the WTI buyers.
Following that, the quote’s run-up to the March 10 low of $63.10 can’t be ruled out.
Overall, WTI battles key resistances and hence sellers should remain cautious even as the MACD flashes bearish signals.
WTI HOURLY CHART


